


Introduction
We introduce clean and safe energy and Meteorological Resources Map for the future.

Research system

meteorological resources
-
Application
Provide meteorological resources information → New and renewable energy policy support
-
Observationi/Analysis
Securing meteorological resource observation → Using basic data to select the location of the power plant
-
Prediction
Production of mid- and short-term forecast information → Stable development complex operation support
Research purpose
With the recent development and support of the national renewable energy industry, it is increasing that the demand for scientific information on meteorological resources (wind and solar) related to renewable energy sensitive to meteorological and climate changes. Accordingly, the National Institute of Meteorological Sciences is developing diagnostic and predictive information production technologies for wind and solar meteorological resources.
-
Global Wind Cumulative Capacity
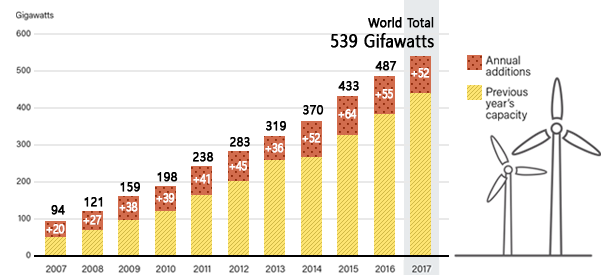
Global wind power cumulative capacity graph image 2007 2008 2009 2010 2011 2012 2013 2014 2015 2016 2017 94 Gifawatts (Annual additions +20) 121 Gifawatts (Annual additions +27) 159 Gifawatts (Annual additions +38) 198 Gifawatts (Annual additions +39) 238 Gifawatts (Annual additions +41) 283 Gifawatts (Annual additions +45) 319 Gifawatts (Annual additions +36) 370 Gifawatts (Annual additions +52) 433 Gifawatts (Annual additions +64) 487 Gifawatts (Annual additions +55) 539 Gifawatts (Annual additions +52) -
Global Solar Cumulative Capacity
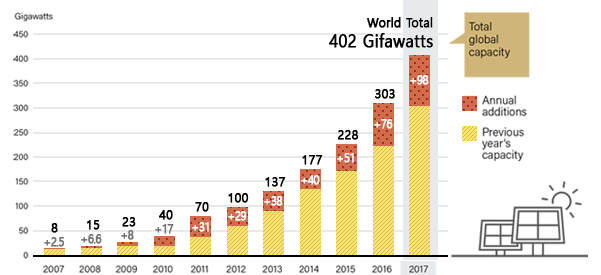
Global Solar Cumulative Capacity 2007 2008 2009 2010 2011 2012 2013 2014 2015 2016 2017 8 Gifawatts (Annual additions +2.5) 15 Gifawatts (Annual additions +6.6) 23 Gifawatts (Annual additions +8) 40 Gifawatts (Annual additions +17) 70 Gifawatts (Annual additions +31) 100 Gifawatts (Annual additions +29) 137 Gifawatts (Annual additions +38) 177 Gifawatts (Annual additions +40) 228 Gifawatts (Annual additions +51) 303 Gifawatts (Annual additions +76) 402 Gifawatts (Annual additions +98)
In the world, the cumulative capacity of wind and solar is increasing every year.
-
Domestic Wind Cumulative Capacity
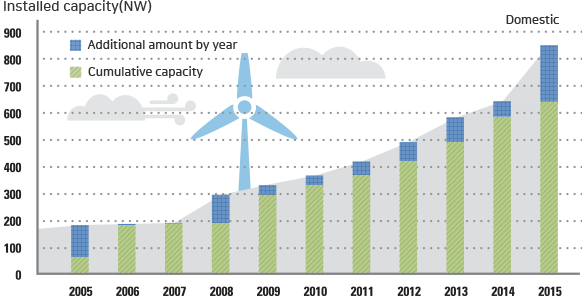
Domestic Wind Cumulative Capacity graph image 2005 2006 2007 2008 2009 2010 2011 2012 2013 2014 2015 Cumulative Capacity about 90MW about 200MW about 200MW about 200MW about 300MW about 340MW about 380MW about 410MW about 500MW about 590MW about 630MW Annual additions about 110MW about 10MW about 10MW about 100MW about 40MW about 40MW about 30MW about 90MW about 90MW about 40MW about 180MW -
Domestic Solar Cumulative Capacity
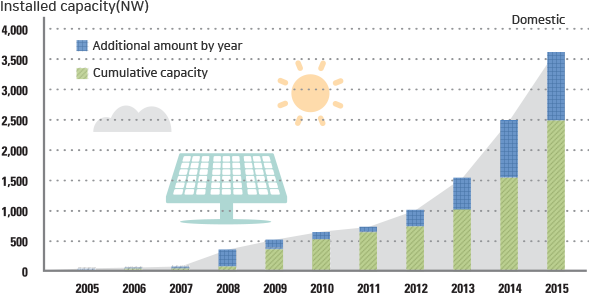
Domestic Solar Cumulative Capacity graph image 2005 2006 2007 2008 2009 2010 2011 2012 2013 2014 2015 Cumulative Capacity about 10MW about 20MW about 30MW about 100MW about 400MW about 500MW about 600MW about 700MW about 1000MW about 1500MW about 2500MW Annual additions about 10MW about 10MW about 70MW about 400MW about 100MW about 100MW about 100MW about 300MW about 500MW about 1000MW about 1000MW